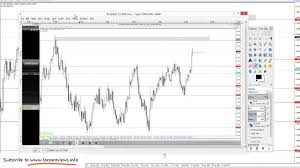
Learning how to use price charts is an indispensable part of Forex trading. There are a few wizened old Forex masters out there who claim not to use charts at all when taking positions, their trading activities are so deeply entrenched in the fundamental trends that charting plays little or no role for them. However, for most Forex traders the use of charts is essential, so it’s of the utmost importance that you get to grips with how they work and how to use them early on. Price charts are graphs that track the changing values of assets in real time. You will ordinarily find a list of the available assets on the left, and a chart of the one you are currently viewing centre screen. FxPro offers trading facilities on two main platforms; MT4 and cTrader. Both have very similar charting functions and indeed most platforms will offer you the same set of basic options. Charting is an huge subject in its own right, but for now you will be introduced to a few basic concepts that will give you an understanding of why charts are important and how they work. We will delve into the subject in more detail when we look at technical analysis later on in the course.
Chart Durations When monitoring an asset’s price you can specify the duration at which changes in price are being registered on the chart. These durations can be anywhere between a single minute all the way up to a month. So if, for instance, you are charting at the monthly duration, every change in the chart will represent a month’s worth of data. This will naturally obscure all of the price moves which occur within the month. Similarly, charting at the hourly duration won’t provide you with any of the changes in price that take place at any period of time shorter than one hour. This is why the shape of the chart changes so radically at different time frames; you are effectively viewing the same data at different resolutions. Regardless of the time frame you select, all of the trading data is being recorded down to the minute,
so you can go back at any point and see exactly what took place at the shorter durations. Open your trading platform and chart a currency pair at the monthly duration. Change this to weekly, then daily, and gradually move all the way down to the 1 minute duration. Notice how much the shape changes? This is what happens when you narrow in to reveal more and more information about what is happening at the shorter time frames. The time frame you choose will be largely dependent on your trading style. If you are opening and closing multiple positions within a single day then obviously a daily chart will not provide you with sufficient data to make educated choices. Similarly if you are taking long term positions which you intend hold for weeks, charting at the one minute time frame won’t provide you with any useful information regarding the deeper trends that are at work. Picking a suitable time frame, and indeed learning to switch between them to gain a wider, or more localised perspective, will become more important as you begin to develop your own trading system.
Learn more at:www.fxpro.com

No comments:
Post a Comment